 |
 |
||
Electrical Propagation in the Pregnent Uterus |
 |
||
|
Wim J.E.P. Lammers1 Uterine segments from either pregnant rats or guinea pigs were obtained from the animals after appropriate anesthesia (2). The segments were then positioned in a tissue bath and kept alive by a flow of fluid (Tyrode), which had been oxygenated by carbogen (95% O2 and 5% CO2) and warmed to 37oC. A 240-extracellular recording array (10 x 24; 2 mm inter-electrode distance; Teflon-coated silver wires; 0.3 mm diameter) was positioned on the segment (Fig. 1). In other experiments, a different electrode array was used with a 10 x 24 distribution and an inter-electrode distance of 2 mm. With these electrode arrays, 240 electrograms could be recorded simultaneously. All 240 signals were amplified (4000x), filtered (2-400 Hz) and digitized with a 1000 Hz sampling rate (see for more details [1]). Selected 32-sec recordings were analyzed and the propagation of the spikes were reconstructed. In the pregnant uterus, electrical activities occur in bursts that each consists of a series of 100-1000 individual spikes. In the rat, each burst occurs about once every 1-2 minute while in the guinea pig, the interval between bursts is much longer; approximately 10-20 minutes. With the data recorded from the 240 electrodes, we could reconstruct the propagation of every single spike (Fig. 2). The conduction of single spikes was found to be highly variable and depended on a) the level and spatial dispersion in excitability and b) whether conduction occurred predominantly in the circumferential or longitudinal direction. Furthermore, conduction was often complicated by the occurrence of a) local pacemakers, b) merging of two or more wavelets into a single wave front or c) conduction block [2]. Such variations in conduction disappeared to a large extent if the tissue was divided into small segments (< 2 cm2) and both the location of the pacemaker and the predominant direction of propagation then became more constant [2]. Finally, the occurrence of conduction blocks sometimes induced the occurrence of reentry and circus movement electrical activity [3, 4]. Examples of fibrillatory activity and reentry are shown in Figs. 3 and 4. In conclusion, spontaneous variations in speed and direction of propagation at pre-term could provide for the necessary asynchrony in electrical activation during myometrial bursts as required to prevent forceful contraction and premature labor.
References
Figure 1: View of the 240 electrode �brush� arranged in a 15 x 16 matrix with an inter-electrode distance of 1 mm. Each electrode is a Teflon-coated silver wire. All electrodes extend for about 3 mm from the dental base to allow tissue fluid to reach the surface of the myometrium. (From www.smoothmap.org). 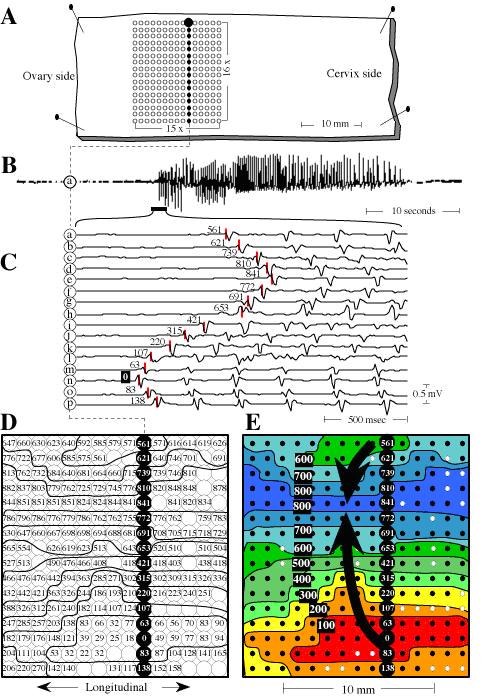 Figure 2: Recording, analyzing and reconstructing the propagation if individual spikes in the pregnant myometrium. Panel A: displays the size and orientation of the rat preparation in relation to the recording electrode array shown in figure 1. Panel B: displays the trace from one electrode (electrode �a�) showing a typical myometrial burst. Panel C: From the beginning of the burst, 16 electrograms, recorded from a single column, highlighted in panel A, are displayed. The spikes in each lead do not occur simultaneously but occur earlier at some sites and later at other sites. Activation time was determined by the rapid negative down stroke in individual spikes as indicated by short vertical lines. Timing of the first spike (at electrode 'n') was used as reference (t=0 in milliseconds). After all 240 electrograms were so analyzed; the local activation times were displayed in a grid representing the original electrode array (panel D). At some sites the quality of recording was too poor to permit reliable timing (empty circles). To visualize the spread of activity, isochrones were drawn around areas activated in steps of 100 msec. Panel E: final product whereby the propagation map was simplified by leaving out the actual times of activation. The isochrone colors depict the spread of excitation and the filled dots represent the sites from which local times were obtained to give an impression of the mapping resolution. (Copyright Springer-Verlag 1997).  Figure 3: Demonstration of reentry in a pregnant myometrium (rat day 19). In all four sequential maps A-D, a wavefront is seen circulating in a counter-clockwise direction. First activity (red color; time=0 at site 'a') was detected in the centrum in map A. From this area, the impulse conducted to the left, the upper and the lower part of the map but not to the right. The impulse in the lower part of the map gradually turned around and propagated to the right, finally reaching the right part of the map and close to the first �red� isochrone. The advancing wave front was not blocked, but continued to propagate in the previously activated area (reentry at t=270 msec) as shown in map B, thereby initiating a new revolution. This sequence continued for several more revolutions as shown in maps C and D. From the leading front of the propagating impulse, electrograms were selected and displayed in the bottom panel (electrodes 'a - l'). Starting with a first spike in electrode 'a' (time=0), a continuous sequence of propagation is visible from one electrode to the next for several revolutions. (Copyright Springer-Verlag 1997).  Figure 4: 'Fibrillation' in the pregnant uterus recorded with another type of electrode array (24 x 10 electrodes; 2 mm inter-electrode distance). Maps A to D display a continuous sequence of propagation during a period of 2.8 seconds. Isochrones were drawn every 100 msec. In map A; one wave front was present originating from site 'a' which propagated towards the ovarial and the cervical end of the preparation. The sequence of activation was interrupted by the appearance of two lines of conduction block I and II. The impulse revolved around block II and re-excited the tissue at t3 = 1000 msec (activation map B). This reentrant wave front merged with a spontaneous impulse originating from site 'b' and revolved once more around block II. At t = 1400 msec, a third line of block appeared which divided the reentrant impulse into two separate wavelets; w1 and w2. As shown in activation map C, w1 reentered once more at t4 = 1500 msec whereas w2, which had revolved around block III followed the propagation of w1. Thereafter lines of conduction block II and III merged together into one long line of block forcing w1 to propagate further to the cervical end of the tissue. Map D shows the propagation of wavelet w2 in the lower part of the tissue which is similar to the previous propagation of w1 in map C. Wavelet w1 however rotated in a much smaller loop around block V and merged with w2 in the right part of the tissue. (Copyright Mosby Inc 1999). |
|||
